

Is a Master's in Computer Science Worth It?
A master's in computer science may take you two years [...]


Data is an invaluable tool for identifying trends, devising forecasts, and making better business decisions. But useful insights do not reveal themselves automatically; it takes skill and expertise to cull and distill meaning from raw data. It takes data visualization engineers.
If you have an interest in data and want to help companies and other institutions apply data-based insights effectively, a career as a data visualization engineer could be your calling. Keep reading to learn about the responsibilities, requirements, and benefits of this professional path.
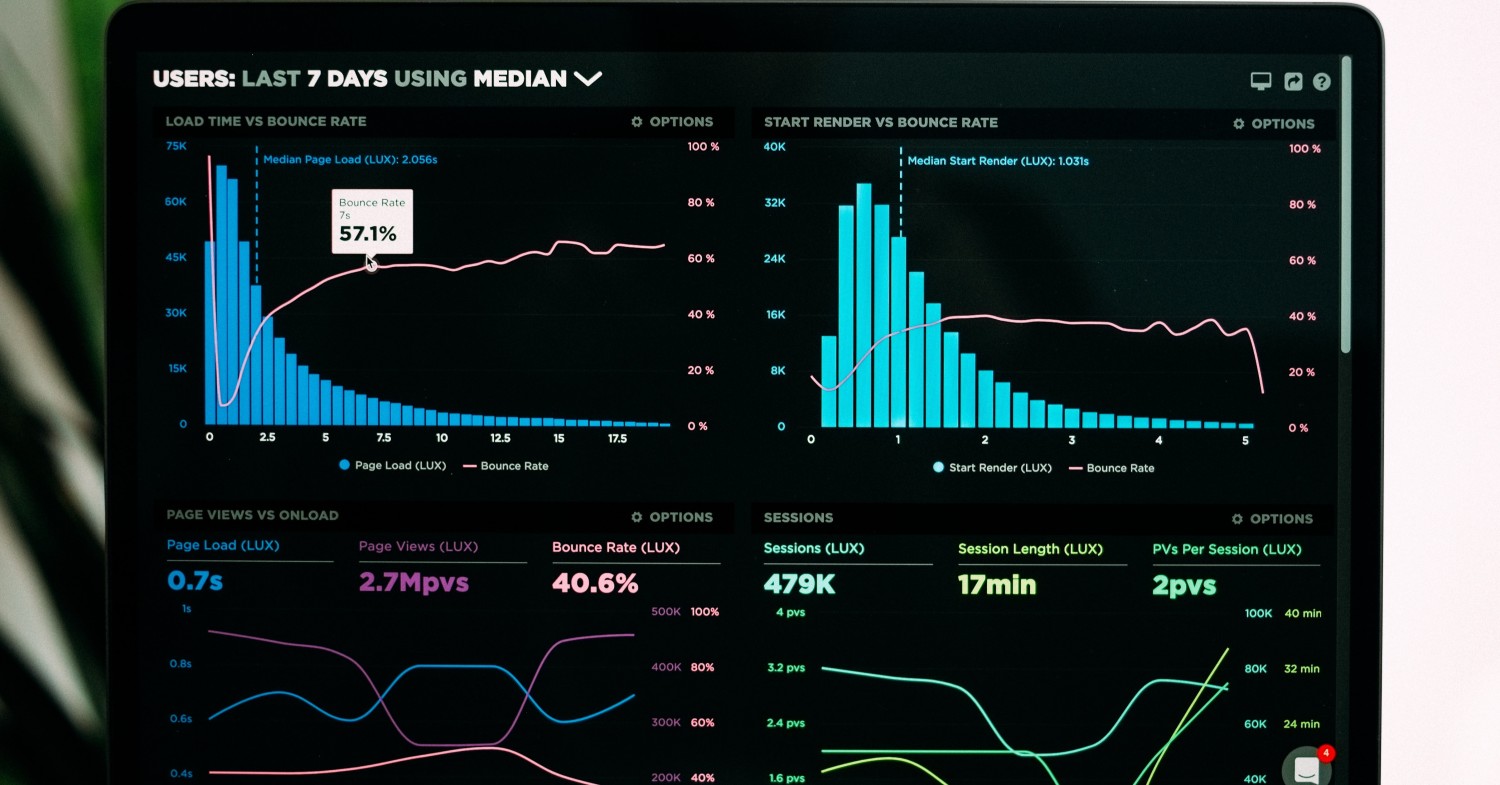
Data visualization engineers represent data in a way that non-technical people can understand. They do this through infographics, graphs and charts.
A good engineer knows how to match the data to the correct graphical format. A line graph is effective at profiling population growth over time. A bar graph might better illustrate sales data for competing products. A pie chart can clearly show the age groups for whom a marketing campaign is most effective.
The visual style used to display statistical trends should also vary depending on the data’s intended audience and the information that the audience wants to see and understand. A presentation for subject matter experts can be more detailed than one for a general audience, for example.
Data visualization engineers rely on conventional data visualization tools but they can also develop their own. An ambitious data visualization specialist remains current on the latest trends in the field and seeks new data analysis tools as well as new ways to present data.
| University and Program Name | Learn More |
|
Boston College:
Master of Science in Applied Economics
|
|
|
Boston College:
Master of Science in Applied Analytics
|
|
|
Merrimack College:
Master of Science in Data Science
|
To enter this relatively new field, you must be passionate about data and enjoy creatively presenting that data with easy-to-understand visuals. But to really stand out in this industry, additional skills and expertise are needed.
From a technical standpoint, data warehousing skills are essential; these entail aggregating data from various sources in preparation for later analysis. You’ll also want to know SQL so you can retrieve data on your own. Python-based visualizations are also useful in designing statistical graphics. Experience in statistics will be solidly to your benefit.
Branded tools such as Tableau, Yellowfin, and Qlik Sense cater to customers with business intelligence needs. Since these tools evolve over time—Netflix uses numerous software titles—it’s helpful to be a quick learner. Acquainting yourself with new software by reading technical guides and engaging in experimentation will make you an asset to any company.
Data visualization includes significant design elements. You must understand the best ways to represent your data, often building novel charts instead of using templates. Beyond statistical visualizations, you may be called upon to provide dynamic data visualizations, allowing users to retrieve data pulled from multiple databases, possibly dating back several years.
But by far the most useful skill to have as a data visualization engineer is the ability to stay calm through change. Client needs, directives from superiors, and software vary continuously. If you’re able to adapt, you will find success in this career.
A bachelor’s degree is a great start for this career. Many undergraduate programs offer data visualization programs that teach foundational principles. As you advance through your program, consider seeking an internship to gain real-world experience.
Although you can work in data visualization without a master’s degree, advanced schooling will likely increase your salary and long-term earning potential. It should also open up leadership opportunities down the line.
Interested in a short-term course to learn the foundational principles of data engineering? Edward Tufte offers excellent one-day online options. Tutfe is a professor at Yale and is regarded as a pioneer of data visualization.
You can purseu data visualization certifications online as well. A certification will develop your skills and help you stand out among other job candidates.
Popular companies that rely on data visualization include Netflix and Spotify. These powerhouses build social media campaigns with data and use data to drive their interactive apps.
Of course, as a data visualization engineer, Netflix and Spotify will hardly be your only options. Your skills will qualify you for jobs at a variety of establishments, ranging from hospitals to banks. New York and San Francisco both offer rich opportunities for data visualization engineers.
Working as a data visualization engineer gives you the chance to make substantial earnings. PayScale indicates that the average salary for a person in this role is $98,264. Salary.com offers a similar estimate of just over $97,000 per year.
As with any job, your starting salary might be low—but this number will increase in direct relation to the experience you gain, and the value you deliver to employers. If you already have some data visualization certifications on your resume, it may be possible to negotiate for a higher salary, even as a beginner.
Successful data visualization engineers know that the job isn’t just about making nice charts. Even more important than creating visual appeal is the ability to ensure your data presentation actually helps people interpret the information.
If you’re interested in combining data and design, a career as a data visualization engineer could be a rewarding way to use your skills across various industries.
.
Questions or feedback? Email editor@noodle.com
A master's in computer science may take you two years [...]

From financial services to manufacturing, industries across the board need [...]
Quant nerds can make a lot of money in data [...]

These days, businesses are collecting more data than ever before, [...]
Categorized as: Data Science, Information Technology & Engineering