

Data Scientists: What They Do, How Much They Make
Quant nerds can make a lot of money in data [...]


Logistic regression in simplest terms is a problem of binary classification: given a set of measurements on individuals in a population, can we predict which individuals do (or don’t) have a certain property? For example: can we predict whether a potential customer will make a new purchase based on their browsing time, income, and past purchases? Can we predict whether a bus will be late based on time of day, weather, and month?
As with ordinary least squares linear regression, we will build a logistic regression model based on independent x-variables (predictors) with the goal of predicting the dependent y-variable (response). In OLS models, the y-variable is continuous; in logistic regression, the y-variable is binary (typically coded 1 for “yes” and 0 for “no”).
To demonstrate logistic regression in practice using Python, we consider the problem of classifying the origin of glasses found at crime scenes. The data for 214 glass samples found in glass.csv are available under a Creative Commons Attribution 4.0 International (CC BY 4.0) licence and is hosted at the UCI ML Repository.
For each glass sample, the researchers recorded its glass type and measured its refractive index (RI) and its weight percent in corresponding sodium (Na), magnesium (Mg), aluminum (Al), silicon (Si), potassium (K), calcium (Ca), barium (Ba), and iron (Fe). Our goal is to determine whether the glass is non-float building glass (type 1).
| University and Program Name | Learn More |
|
Pepperdine University:
Online Master of Business Administration
|
|
|
Boston College:
Master of Science in Applied Economics
|
|
|
Boston College:
Master of Science in Applied Analytics
|
|
|
Merrimack College:
Master of Science in Data Science
|
We require several Python packages to perform our analysis. If they are not yet installed on your system, follow the links and install them before starting.
We load import these packages into Python with a series of import statements:

We load the data into a data frame (table) called glass_df and drop the ID column from the data set (the glass specimen is uniquely identified by ID but ID will not be helpful in identifying glass type). We then create a binary variable Glass which is 1 if the glass is non-float building glass, and 0 if it is any other type of glass. This aligns with our classification goal.
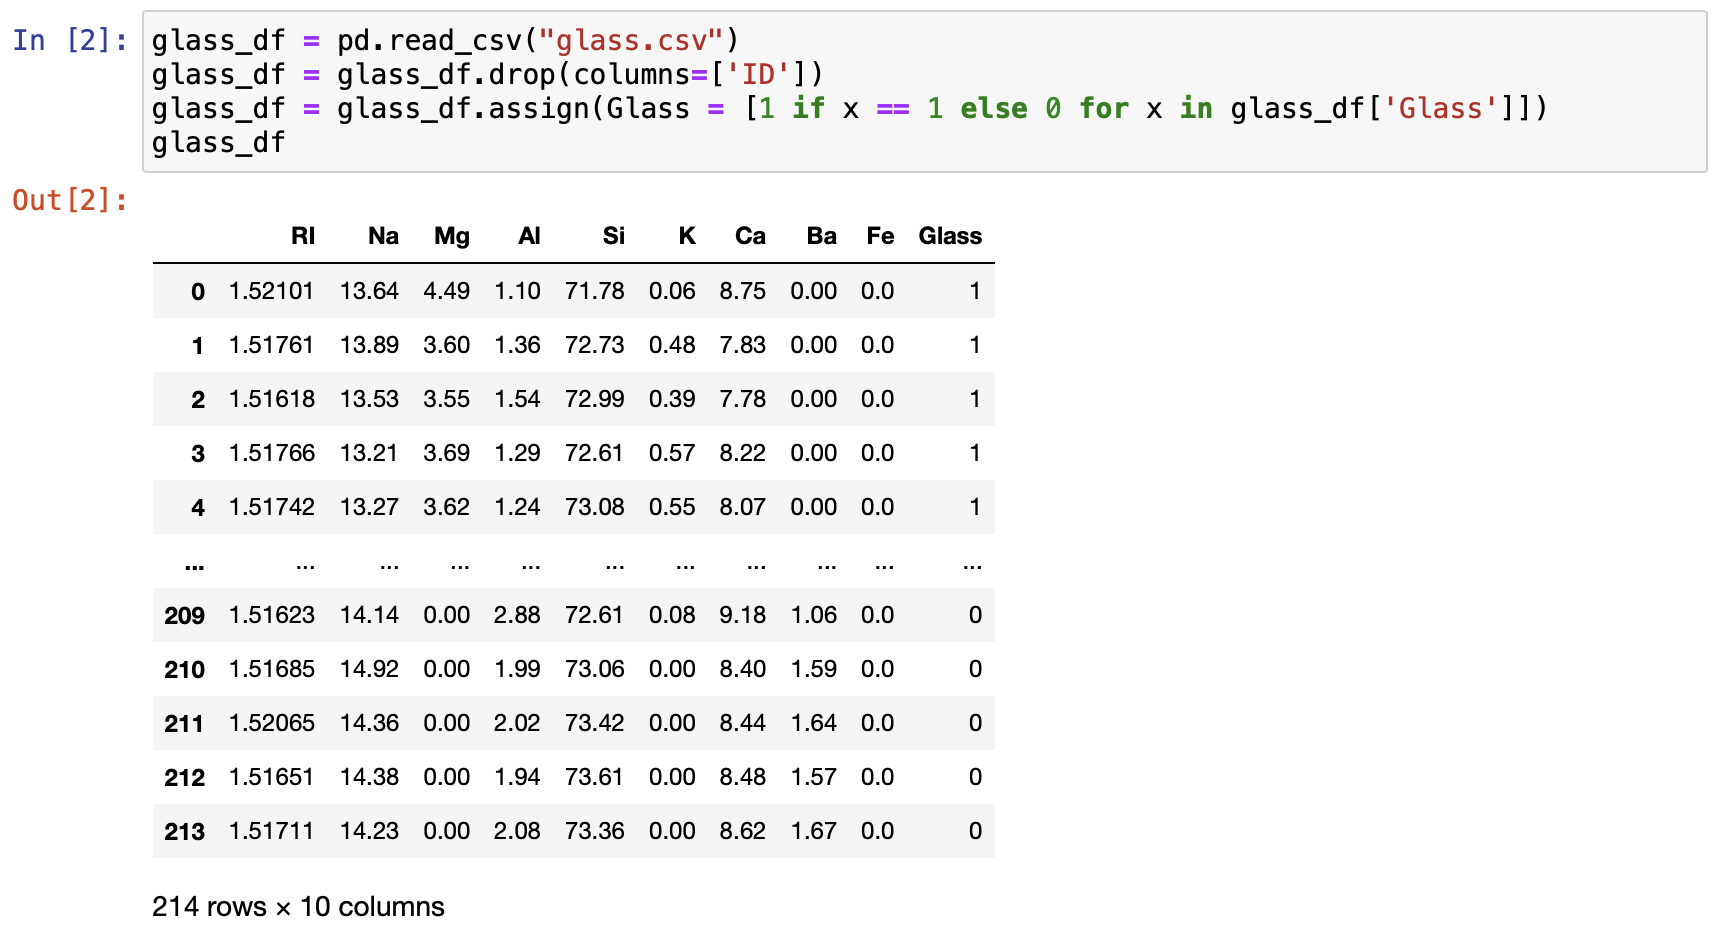
Finally, we should summarize the data using the describe() method to see if any apparent outliers or missing values exist. No missing values are observed and the minimum and maximum values for each of the element types are not too extreme relative to the median and quartiles.

In preparation for running the logistic regression model, we must create a variable to hold the y-variable and a variable to hold all the X variables. As a technical requirement, statsmodels requires that we explicitly add a constant to our X variables to include an intercept in our model.

Since the logistic regression model is somewhat complicated, it is worthwhile to discuss its necessity. Why can’t we treat the 0-1 variable as continuous and run an ordinary least square regression to predict which group the individual is in? To demonstrate, we plot the glass type (1 or 0) versus one of the X-variables, Hg.
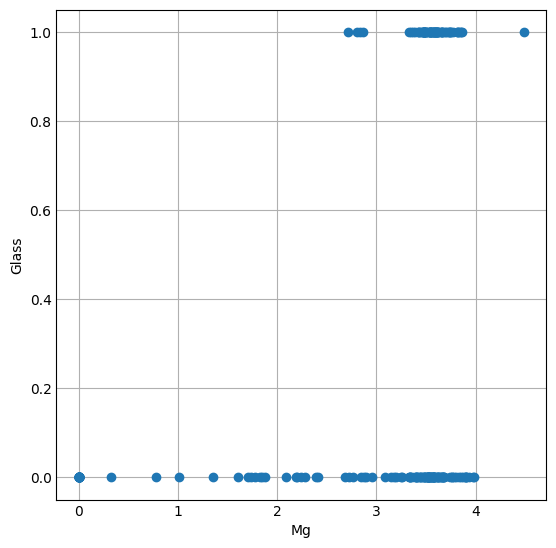
One immediately notices that this scatter plot does not show a linear relationship. The y-value of an observation is 0 across the range of Mg, and 1 across the upper range of Mg. Unfortunately, there is nothing in the middle to flush out a possible regression line. What we could do instead is to estimate the probability p of being in class 1 by adding the regression line anyway:

Using this model, we predict the probability of being glass type 1 by plugging in the Mg-value. Classification is then accomplished by rounding: probabilities at least 0.50 are classified as glass type 1 and probabilities less than 0.50 are classified as another glass type. This approach to using a linear regression to estimate probabilities is still problematic: it can predict probabilities less than 0 or more than 1. For example, the predicted probability for a glass with 0% Mg by weight is negative (approximately —0.04).
The logistic regression model solves the problem of predicting probabilities that are smaller than 0 or larger than 1. This is accomplished by estimating instead the logit of the probabilities, defined by the natural logarithm of the odds ratio:
Note that p1-p is called an odds ratio since it quantifies how much more likely y=1 is than y=0. For example, if p=0.80, there is a 1-p=0.20 probability of y=0 and thus y=1 is p1-p=0.800.20=4 times more likely than a y=0 to occur. When p=1, we have logit(p)=-∞.
We estimate the logit using a linear function by fitting the linear model (where β0 is the intercept and there is a βj-slope for each of the n independent X-variables)
The logistic regression model computed from Python will give us the estimates for the intercept and the n slopes. Once we have them, we can finally compute the probability for each outcome by solving logit(p) for p:

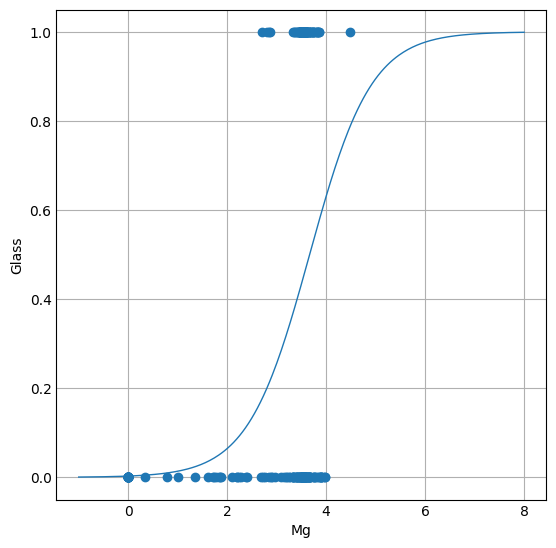
This somewhat complicated function will always be estimated with software since the computations are quite tedious. The probability function that comes from logistic regression has an S-shape, where the tails of the S approach 0 going to the left and 1 going to the right. The graph below shows the probability curve when considering only one X-variable, Hg (note that probabilities now are completely bounded between 0 and 1, as opposed to the ordinary least squares linear regression).
To create a logistic regression model in Python for these data uses the Logit() function in the statsmodels package. The logit function works only for binary classification, which is our goal here. Once we create a Logit() model with y and X and inputs, we then run the fit() method to actually fit the model to our data and store in the variable log_reg. The logit function has the method summary() which prints an extremely helpful and detailed summary table for the logistic regression model. The output includes the estimates of the βj coefficients (the coef column) for the probability function, as well as their standard error, z-scores, p-values and 95% confidence intervals. In general, any coefficient with |z| > 1.96 (or, p-value less than 0.05) is a significant contributor to the positive classification of a glass specimen. For classifying crime scene glass as non-float household glass (type 1), it would seem that magnesium (Mg), silicon (Si), potassium (K), calcium (Ca), and barium (Ba), are significant classifiers.
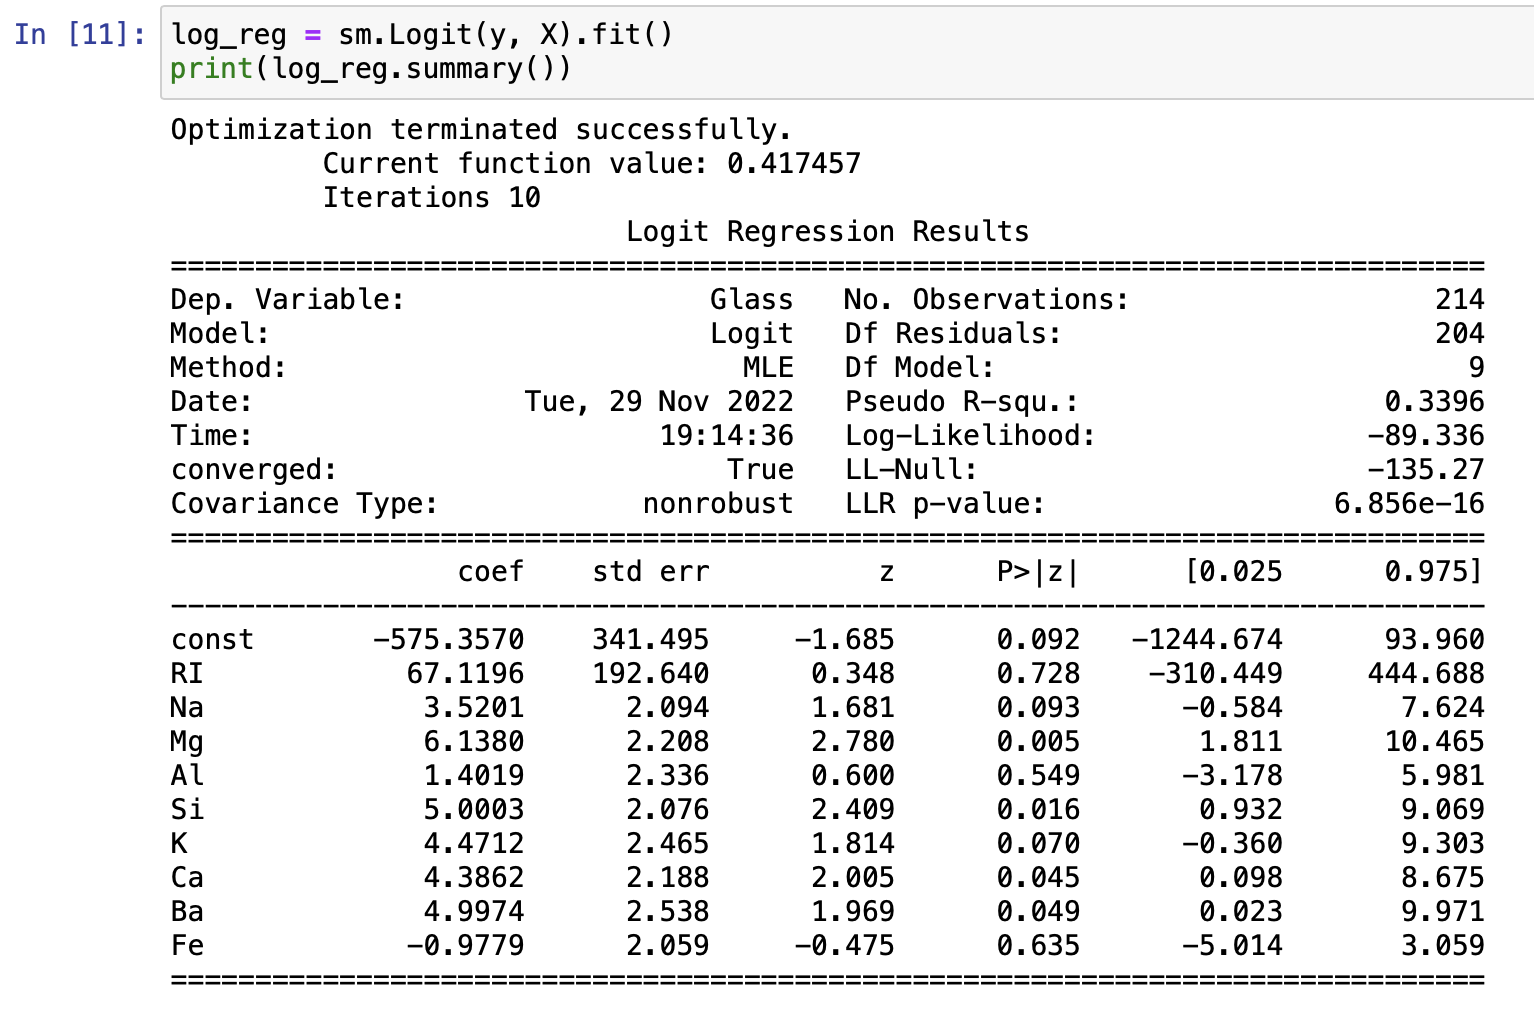
Because the logistic regression model estimates the logarithm of the odds, we can exponentiate the coefficients to obtain the odds directly. For example, a 1% increase in barium content is a e4.9974=148.03-fold increase in the odds of the glass being type 1. We can summarize all of these odds ratios and their corresponding intervals by combining them into their own data frame. The Logit() object conveniently stores these data in a params object and in the conf_int() method. Notice the odds ratio for iron is less than 1; the odds ratio 0.376 means that an increase in iron content reduces the odds of the glass being of type 1.

Finally, we assess this model in its ability to classify the origin of glasses at a crime scene. In a logistic regression, we will assess the model according to its accuracy:
That is, the accuracy of the model gives the percentage of individual glass samples that the logistic regression model correctly classifies as a 0 or a 1. To compute this, we first must use the model to make a prediction for each individual glass specimen. The predict() method of the Logit() object takes as an input a set of X-values to make predictions from and produces a list of predictions. These predictions are decimal numbers (probabilities) so we round these to the nearest of 0 and 1 (the map() function applies the round() function to each element of the predictions list yhat). We then add this list as a column to our glass sample data frame. Notice that the prediction column and the glass type column are not equal; our model does not do a perfect job of classifying glasses as non-float housing glass.

Finally, we create the confusion matrix, which breaks the sample into correctly classified glass, false positives, and false negatives. From the matrix, we read that 127 of the glasses were correctly classified as 0s and 42 were correctly classified as 1s. That is, 127+42=169 of the 214 glasses were correctly classified and the accuracy of this model is 169214=79%.


In this article, we introduced logistic regression as a tool for binary classification (of an individual as a 0 or a 1), with techniques for determining the odds of being classified as a 1 and assessing the accuracy of a classification model. We created a logistic regression model in Python to classify 214 glass samples according to their origin. The model correctly classified 79% of the glasses. We were also able to determine which elements most significantly affect the odds of a glass originating from non-float household glass.
.
Questions or feedback? Email editor@noodle.com
Quant nerds can make a lot of money in data [...]

These days, businesses are collecting more data than ever before, [...]

Looking for a career in academics, actuarial science, business analytics, [...]

The difference between data analytics and data science isn't as [...]

Everything you learn in a data science master's program is [...]
Categorized as: Business Intelligence & Analytics, Data Science, Information Technology & Engineering